
Making Performance Assessment Easy
Reporting on digital product performance shouldn't be an exercise in data archaeology. We transformed a fragmented landscape into a strategic asset.

Consolidating Platforms
Reckitt’s data was fragmented across disparate sources including Shopify (eCommerce), Salesforce (CRM), Silktide (Site Quality), Google Analytics and more. Our primary goal was to unite these sources into a single platform to eliminate the friction of cross-system navigation.

Selecting What Really Matters
True executive reporting operates on a "What, So What, What Now" framework. We stripped away the noise to present the most critical "What," leaving deeper analysis for collaborative deep dives with analysts. This restraint doesn't limit information—it creates the focus necessary to stimulate action.
Creating Reckitt's Core Web Metrics
We didn't just build a report; we built a bridge. By embedding Reckitt’s Core Web Metrics directly into Datarama (the environment executives already used for media performance) we bypassed the friction of new tool adoption. This allowed brand. teams to instantly compare performance across markets and categories, placing design impact squarely in the view of the decision-makers who matter most.

Business Value
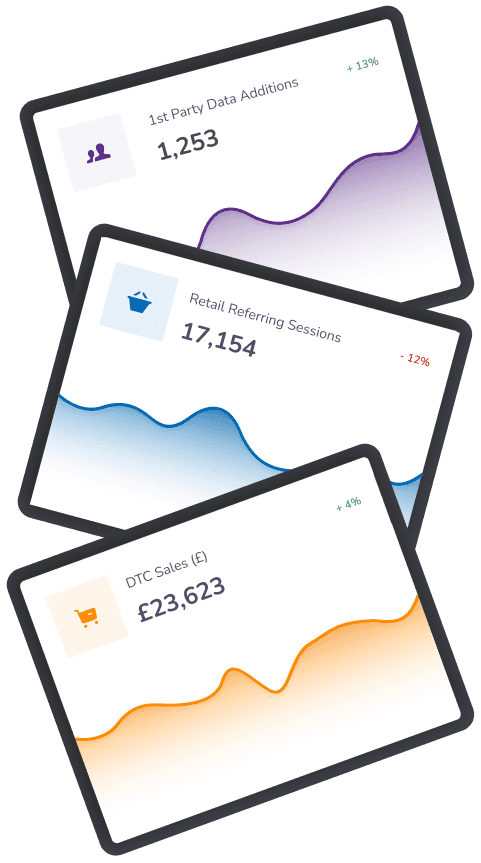
1st Party Data Additions: Captures growth in direct consumer relationships, a core strategic pillar for Reckitt.
Retail Referring Sessions: Tracks our success in driving traffic and maximising exposure to retail partners.
Direct to Consumer Sales: Represents the total revenue generated through brand-owned D2C channels (where relevant).
Technical Performance
Average Silktide Quality: A composite metric aggregating UX, SEO, accessibility, and content standards into a single performance benchmark.
Max Good URLs: A Google signal for the health and performance of the site architecture.
Min Core Web Vitals: A custom RYG summary of Domain technical performance based on Google Core Web Vitals.
Visitor Performance
Engaged Sessions: Total sessions meeting Google Analytics’ "engagement" threshold (ignores low value sessions).
Average Satisfaction Rate: The percentage of user feedback responses scoring 4/5 or higher, providing a direct pulse on consumer sentiment.
The Impact of Design Visibility
Reporting on real metrics quickly shifted design discussions from "Does it look nice?" to "Does it drive business value?"


